 (Sorry, I don't know why this image came out like that - click it to get the proper version)
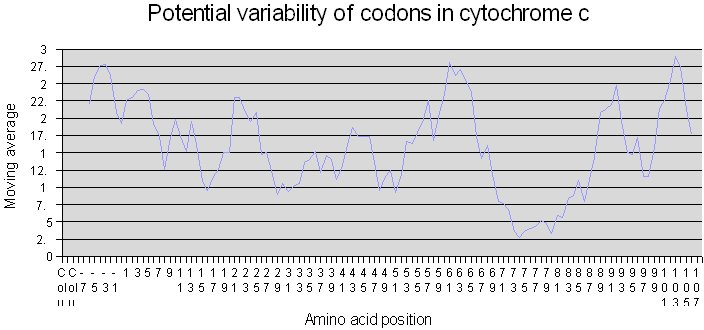
Using the spreadsheet referred to below, I did this graph of the moving average of the variability of cytochrome c across the 113 species. The x axis represents distance along the amino acid chain. It starts below zero, as some species have chains of amino acids that come before the start of the reference sequence. The y axis represents the number of codons that could be used across to encode each position - this drops as low as 2 in some locations, where only one amino acid is present in the cytochrome c of every species. The average rises to almost 30, signifying that around half the 20 occurring amino acids might be used at a particular location in cytochrome c.